Radioactivity Explained
5. Half-life and decay rate
The less there is, the slower you lose it
5.1 The discovery that radioactivity decreases with time
5.2 Stability and randomness
5.3 Radioactivity and half-life
5.4 Half-life calculations
5.5 Half-life and graphs
5.6 Half-life: Radiation uses and risks
5.1 The discovery that radioactivity decreases with time
Short video summary (1:16)
-
Radioactivity always decreases with time
Sometimes the decrease is too slow to observe
-
The radioactivity of uranium didn't seem to change with time. This was very odd - because it didn't ever seem to run out of either atoms or energy.
In 1907 Ernest Rutherford was investigating thorium, which was an element that Marie Curie had found to be radioactive. He found that whenever the lab door was opened the radioactivity seemed to drop and then slowly rise again.
After a lot of thought he concluded that the thorium was giving off a gas which was itself radioactive. When the lab door was opened the gas was blown away and the reading dropped.
Rutherford managed to capture some of the gas (which we now know was an isotope of radon) and he noticed that it's radioactivity decreased with time. It decreased quickly at first and then slower and slower.
In fact, it always took the same time for the radioactivity to fall by half. The time for the radioactivity to drop to half its value became known as the half-life.
-
The thorium wasn't just giving off a gas, the thorium atoms themselves were changing into new elements as they gave off radiation. One of the new elements (radon) happened to be a radioactive gas.
Fortunately for Rutherford (again) radon-220 has a half-life of only 55 seconds, so even a tiny amount is very radioactive (so Rutherford could easily notice the reduction in radioactivity when a draft blew it away), and the radioactivity decreases quickly enough to be easily observable once he had isolated some.
Rutherford noticed that the change in radioactivity was exponential. That relationship is pretty common - it's basically 'the less you have, the slower you lose it'. All exponentials have the 'constant ratio' property, so it's not that Rutherford invented the concept of half-life, simply that he saw that the model was a good fit for radioactive decay.
You have to be slightly careful with the word decay, since it has two separate meanings. We've come across decay meaning a nucleus changing and giving off a particle, but in this case we mean the way radioactivity 'decays' or decreases with time.
Key animations from the video for you to use in front of a class
There seemed to be a mysterious gas
Why didn’t uranium radioactivity change?
Why did drafts seem to matter?

The discovery of half-life

5.2 Stability and randomness
Short video summary (1:32)
-
When a nucleus 'decays' it doesn't disappear - the nucleus changes and it gives off an alpha, beta or gamma.
Radioactive decay is random because
- you can't tell when a given nucleus will decay
- you can tell how many nuclei will decay each second, just not which ones
-
The nucleus of an atom will decay if the nucleus is unstable in some way. A decay always involves two simultaneous events:
The nucleus changes to become more stable
At the same instant a particle or gamma ray is given off
Sometimes the nucleus is still not stable, and may change again and again, giving off an alpha, beta or gamma each time it changes. But we're going to assume that it only takes one decay for a nucleus to become stable.
For a given isotope, every atomic nucleus has a certain chance of decay each second.
If a nucleus has a 25% chance of decay each second, you'd expect it to take 4 seconds to decay. This is true on average but we just can't tell for a specific nucleus. Sometimes it decays after the first second - sometimes it may survive for many seconds. In theory it may never decay.
Nuclei don't grow old. If a nucleus hasn't decayed after 1 second then it gets its 25% back.
It's like tossing a coin - the chances of this throw coming up heads is always 50% even if the last 1000 throws were heads.
When we have a large number of nuclei (by which I mean trillions), each with a 25% chance of decay then we know 25% of them will decay each second. We just don't know which nuclei will do the decaying.
About 25% of the nuclei decay each second, but you can't tell whether a given nucleus will be part of that 25% or not.
It's a common misconception that when a nucleus decays the atom disappears somehow. But this isn't true - the nucleus changes but it's still there. The number of unstable nuclei goes down but only because they've changed into more stable ones. The total number of atoms, and so the total number of nuclei stays exactly the same.
Radioactivity is a random process because:
You can’t tell when a given nucleus will decay
You can tell how many nuclei will decay each second – just not which ones
-
It's very common to believe that nuclei disappear when they decay, and so you need to be careful about suggesting this accidentally. For example, a common exercise is to roll lots of dice and remove the ones that have 'decayed' - in this way the number of dice decreases each time, which really reinforces the misconception.
You occassionally see it suggested that the mass of a radioactive sample decreases, particularly with half-life calculations. The mass of a sample will decrease if it loses alphas, but this is immeasurably small under almost all circumstances. The isotope is almost always part of a chemical compound and/or a mixture of other compounds, and it will have been decaying away happily before any measurements are made.
The mass of undecayed nuclei (atoms) does go down, but only because the mass of decayed nuclei (atoms) goes up.
Key animations from the video for you to use in front of a class
You know how many will decay
How nuclei become more stable
You can’t tell when decay will happen

Radioactivity is a random process
5.3 Radioactivity and half-life
Short video summary (1:08)
-
Half-life is the time it takes for the radioactivity of a source to decrease by half
Half-life is also the time for the number of undecayed nuclei to decrease by half
A short half-life means very radioactive for a short time
A long half-life means not very radioactive for a long time
-
Let's compare the rate of decay of two isotopes which are both beta emitters.
Remember that every time the nucleus of an atom decays it releases a beta particle.
This first isotope has nuclei with a high chance of decay. It's very radioactive to begin with. A few seconds later it's much less radioactive. This is because it quickly runs out of nuclei that haven't decayed yet.
The second isotope has nuclei with a low chance of decay. It's not very radioactive. But this low radioactivity continues for quite a long time. This is because the number of undecayed nuclei stays high for longer. Or if you like it runs out of undecayed nuclei slower.
There's always this trade off. If an isotope has what we call a short 'half-life' then it's very radioactive but not for very long. If an isotope has a long half-life then it's not very radioactive but for a long time. It's impossible to be both very radioactive and to have a long half-life.
So what is half-life?
You can see that the number of undecayed nuclei goes down in a curve not a straight line. In a real sample there would be trillions of nuclei, so there isn't really a time when they all run out. Instead of thinking about the nuclei decaying, let's think about the beta particles given off. We can measure these using a Geiger counter, but we can't count the nuclei directly.
If in one second 10 nuclei decay then 10 beta particles are given off.
So we can use the graph of radioactivity over time, and it will have exactly the same shape.
Imagine an isotope that emits alpha radiation with a half-life of ten years. As we go forward in time it gets less and less radioactive.
Why do we say it's half-life is ten years? Because the radioactivity decreases by half every ten years.
It takes ten years to go from 80 Bq to 40 Bq.
Another ten years to go from 40 Bq to 20 Bq.
Another ten years to go from 20 Bq to 10 Bq.
And another ten years to go from 10 Bq to 5 Bq.
Most people think that half-life tells you only how long something is radioactive for. But it's important to remember that half-life also tells you about how radioactive something is. The longer the half-life, the lower the radioactivity.
-
The idea that half-life not only defines how long an isotope is radioactive for, but also how radioactive it is is very poorly understood in public discourse about radioactivity. In the media half-life is normally used as a short hand for something like 'dangerous life'.
Obviously, the syllabus is mostly about doing half-life calculations, but I think if we're interested in communicating some physics that can actually have real-world influence on energy policy, then we should probably at least mention this half-life/radioactivity trade off.
Key animations from the video for you to use in front of a class
Radioactivity timeline
Short half-life: very radioactive
Long half-life: not very radioactive
Half-life on a decay curve
Half-life and radioactivity trade off

5.4 Half-life calculations
Short video summary (4:25)
-
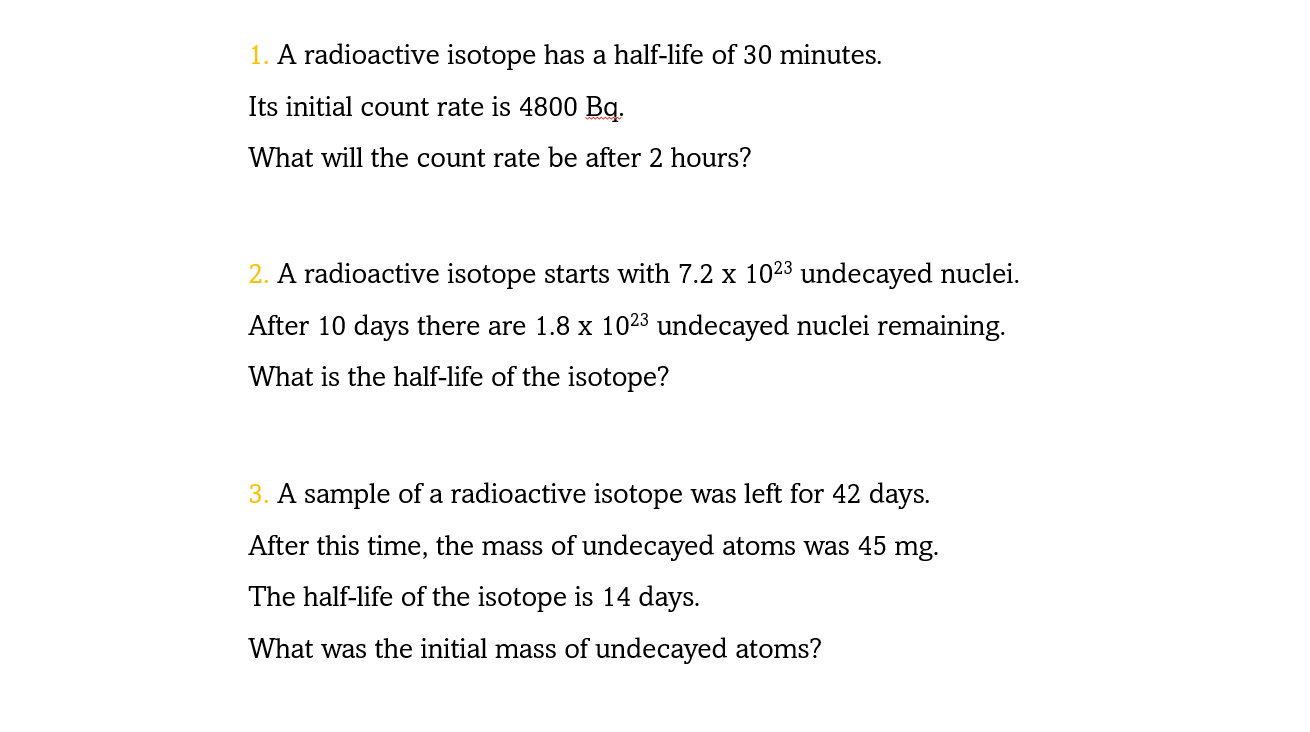
How to answer three types of half-life questions:
- Calculating count rate if you know half-life
- Calculating half-life if you know count rate
- Calculating mass of undecayed atoms if you know half-life and time
-
Whatever the question, you can always answer it by using a table with three rows:
- Half-lives (0, 1, 2, 3, etc)
- Time (0, 1, 2, 3, etc in whatever unit the question uses e.g. days)
- Quantity (e.g. radioactivity, count rate, number of undecayed nuclei, mass of undecayed atoms)
You just fill in what you know, and then use that to fill in what you don't know.
-
It's important to start at time zero, not at 1 half-life.
Some questions imply that the mass of the sample itself decreases, whereas we know it's only the mass of the atoms that haven't decayed yet that goes down. The mass of the atoms that have decayed goes up to keep the total mass constant (apart from the small mass of the alphas or betas).
In practice, the sample will always be decaying so you can't start the decay process - all you can do is start the timing.
Key animations from the video for you to use in front of a class
Q2: Finding half-life

Three example questions
Q1: Finding count rate

Q3: Finding mass

5.5 Half-life and graphs
Short video summary (3:29)
-
How to find half-life from a graph of activity vs. time
How to find activity from a graph of undecayed nuclei vs. time
-
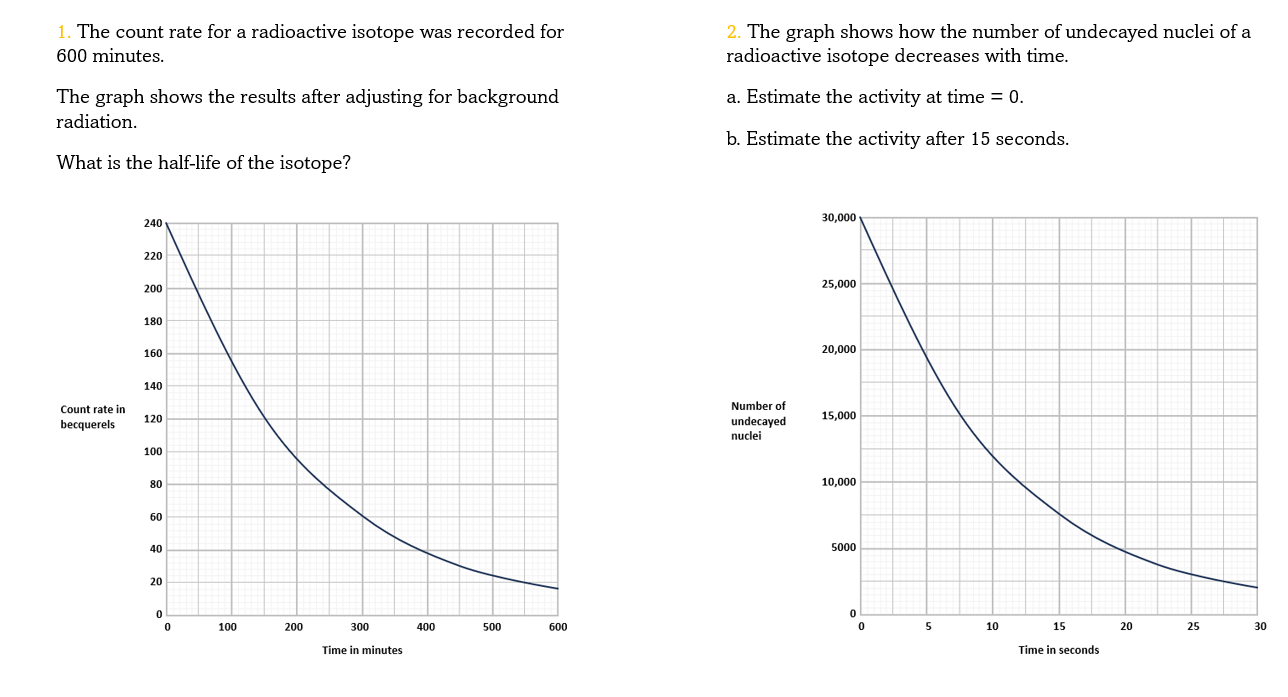
To find half-life from a graph of activity vs. time:
- Find a point on the graph that's easy to read both activity and time from e.g. 140 Bq at 6 hours
- Read off how long it takes to halve the activity from that point e.g. 70 Bq at 8 hours
- The half-life is the difference between the two times e.g. 2 hours
- It took 2 hours for the radioactivity to fall by half from 140 Bq to 70 Bq
- You can check using other pairs of points where the radioactivity halves
Estimating activity from a graph of undecayed nuclei vs. time is a bit trickier.
If the number of undecayed nuclei decreases by 5000 in 2 seconds then 5000 alphas or betas must have been given off in that 2 seconds. So the activity is just 5000/2 = 2500 Bq.
This is only an average because the activity is changing all the time. If the line happens to be pretty straight over those two seconds then the activity hasn't changed much, so this is still a good estimate.
In general, the activity at a given time is equal to the size of the gradient of the undecayed nuclei vs. time curve. The steeper the curve, the higher the activity.
The undecayed nuclei vs. time curve and the activity vs. time curve have exactly the same shape, so you can also use either curve to calculate half-life.
-
The fact that A = -dN/dt (activity is equal to the rate of decrease of undecayed nuclei) is a post-16 concept, and has lots of subtelties associated with it.
I've tried to give a bit of a flavour as to why it's true, but questions in exams that require an implicit understanding of it are rare, so it's probably a rabbit hole you don't want to go down too deeply.
Key animations from the video for you to use in front of a class
Undecayed nuclei and activity
Two example questions
Q1: Finding half-life
Q2: Activity from half-life curve
5.6 Half-life: Radiation uses and risks
Short video summary (3:21)
-
Use a short half-life if you want an isotope to stop being radioactive quickly - like a medical or environmental tracer
Use a long half-life if you want the radioactivity to stay fairly constant - for example a beta thickness gauge or smoke alarm
If you're going to use a short half-life, you need to produce or isolate the isotope close to where it's going to be used, for example with beta plus emitters used in a PET scan
-
We'll look in more detail at uses of nuclear radiation in lesson 6, and radiation health effects and risks in lesson 7. But here are some general principles to do with half-life.
We know of lots of different isotopes with a wide variety of half-lives, so we can usually select one with the half-life we need.
If the radioactive source is going to be introduced directly into the environment particularly as a liquid, for example as a tracer, or injected into someone for medical reasons then you generally want a fairly short half-life - somewhere from hours to days. This means the source ends up with negligible radioactivity quite quickly.
Some machines like smoke deteactors and thickness gauges rely on having a steady flow of radiation for months or years. This means having a long half-life, because by definition a long half-life means the radioactivity doesn't change very much from day to day.
A long half-life is fine because the isotope is a solid and contained within the machine and isn't intended to be set free into the environment. Half-lives of tens to hundreds of years are common for these kind of jobs.
The challenge with using an isotope with a short half-life is you can't keep a store of it. An isotope decays continuously - you can't just switch it on and off. A PET scanner, for example, helps doctors see how a patient's organs are working.
It involves injecting the patient with an isotope that has a half-life of under two hours. The isotope needs to be made in the hospital or very nearby. It involves an expensive and complex machine called a cyclotron, which forces an extra proton into a normal nucleus at very high speed to make it temporarily radioactive.
For risk and half-life we need to remember that long half-life means low radioactivity. Something can only be radioactive for a long time because its nuclei decay slowly.
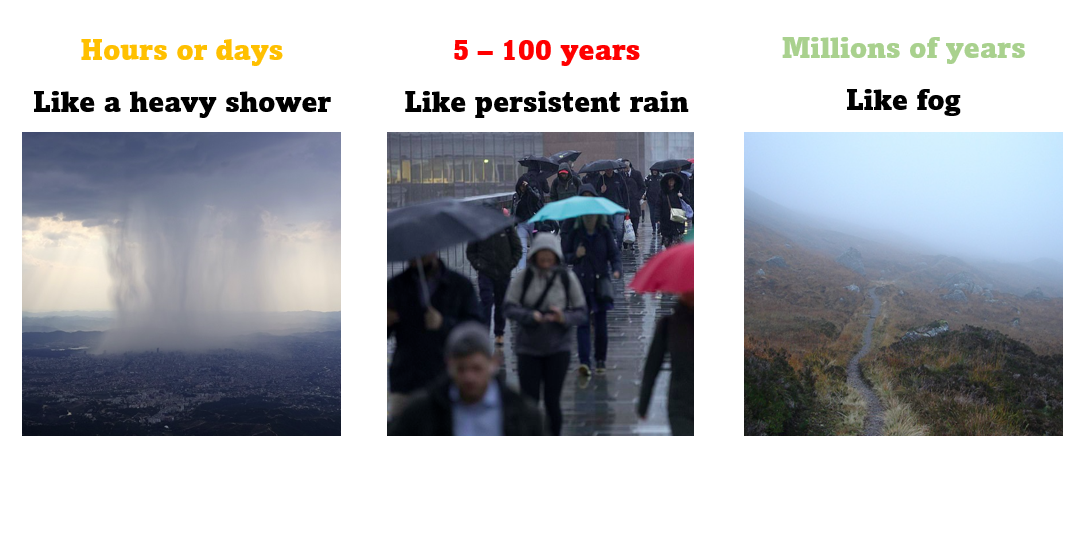
It's common for people and some exam questions to worry about the risk of very long half-life waste from nuclear power plants. If you're worried about getting wet then the radiation from long-lived waste is more like fog than a thunder storm.
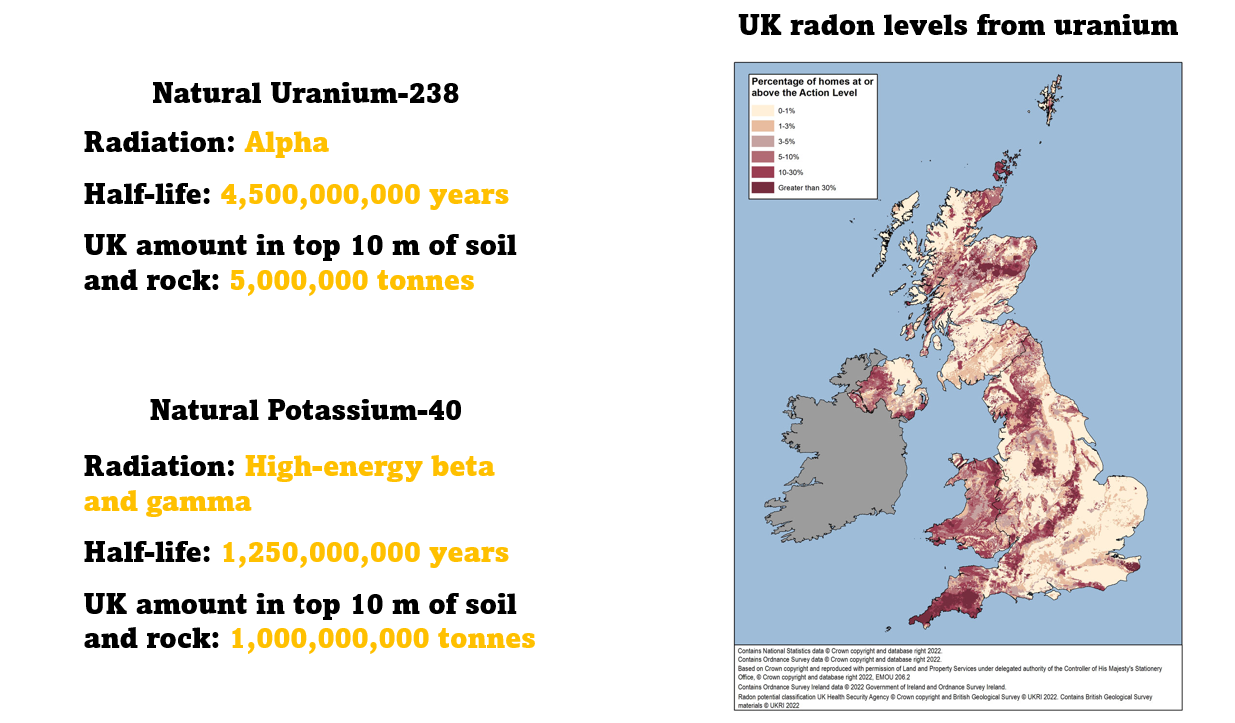
We're surrounded by vast quantities of natural radioactive isotopes that have an incredibly long half-life. Uranium-238 is an alpha emitter with a half life of 4.5 billion years. In the top 10 m of UK soil and rock there's about 5 million tonnes.
Potassium-40 is a high-energy beta and gamma emitter. It has a half life of one and a quarter billion years, and in the top 10 m of UK soil and rock there's about a billion tonnes.
All of life on Earth has evolved with the radiation from these natural radioactive isotopes.
Short half-lives are like a heavy shower - very radioactive but it's easy to wait them out. The most hazardous half-lives are actually about 30 years - these are like persistent rain. They're significantly radioactive for the length of a human life-time.
-
Though the idea of open and closed sources is not part of the syllabus, it's a useful and interesting distinction.
Open sources are typically liquids used for tracers that are effectively just released into the environment. Open sources are chosen to have a short half-life.
Closed sources are normally solids enclosed in a device or machine. They are chosen to have a long half-life so the radioactivity doesn't change much with time, and you don't need to keep replacing the source.
Key animations from the video for you to use in front of a class
Comparison with natural isotopes
Uses of long and short half-life isotopes

Radioactivity and rain analogy